
Networking Dashboard v01
21 Aug 2012
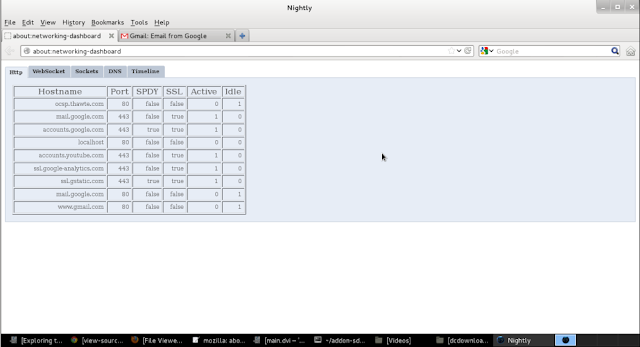
Networking Dashboard is a tool that shows internals of networking of Firefox. It's an add-on that I have made as part of GSoC project and can be used by typing 'about:networking-dashboard' in URL bar after installing this add-on. It shows current open connections with host names, how many of them are active/idle, if they are using SPDY or not, if they are using SSL or not, DNS cache entries, total data sent and received, data related to WebSocket connections etc. I have blogged about it in detail in my previous post.
Following are some screen shots which might give you some idea about the tool.
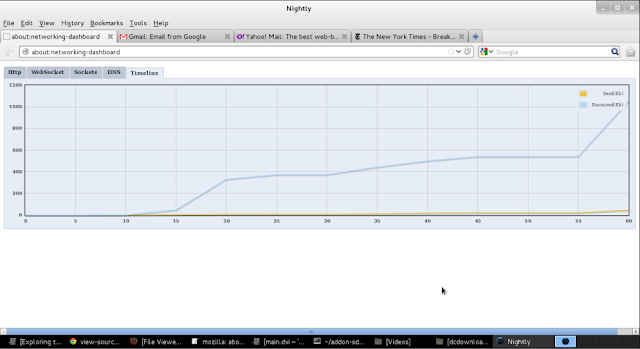
Timeline shows graphical view of total data sent and received after starting the add-on.
One feature that I couldn't implement as part of add-on is header window which shows sent and received headers of the packets Http connections.
I have used jQuery and flot - a pure Javascript plotting library for jQuery - for building the add-on. I can make the add-on available but it won't work because back end part of the code hasn't been migrated to mozilla-central yet.
Socket Connections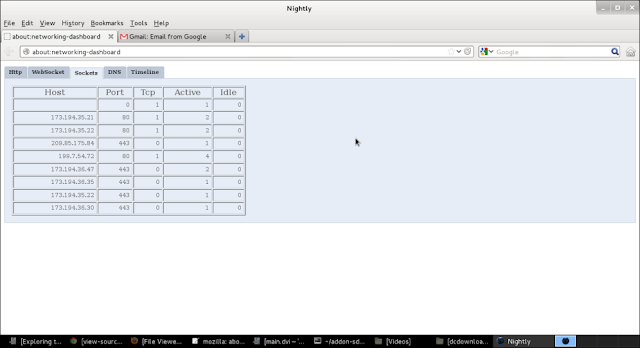
Following are some screen shots which might give you some idea about the tool.
Timeline shows graphical view of total data sent and received after starting the add-on.
One feature that I couldn't implement as part of add-on is header window which shows sent and received headers of the packets Http connections.
I have used jQuery and flot - a pure Javascript plotting library for jQuery - for building the add-on. I can make the add-on available but it won't work because back end part of the code hasn't been migrated to mozilla-central yet.
Http Connections
Socket Connections
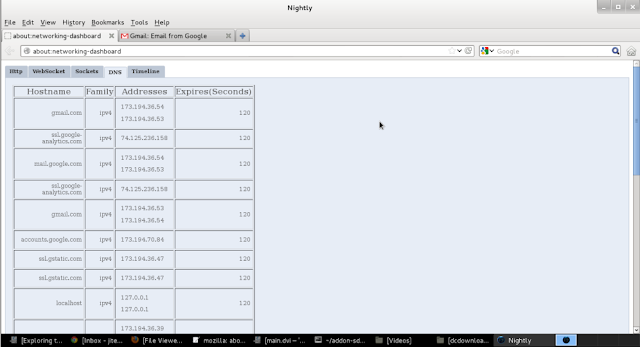
DNS cache entries
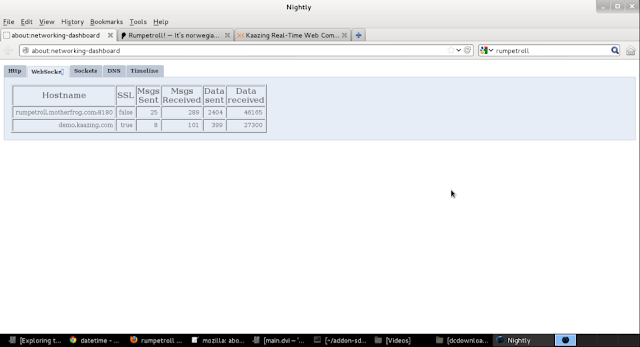
WebSocket connections
Timeline showing graph of total data sent and received
- Tags: GSoc 2012 Networking Dashboard Mozilla
Discussion, links, and tweets

Software Engineer at AWS using simulation to train robots. I am obsessed about history.
Tweet Follow @jiten_mt